| A new
Instrument for RHEED applications - RHEA 100 - Energy Analyzer for filtering and in-situ Electron Energy Loss Measurements |
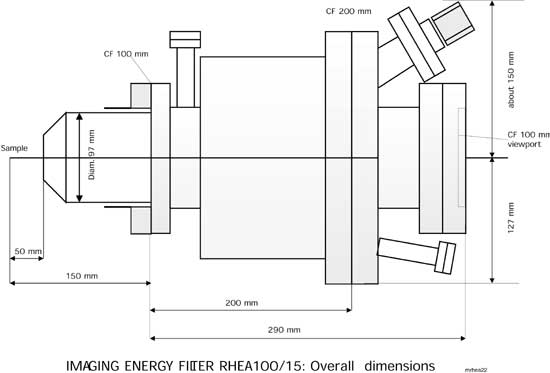
Figure 1 |
The RHEA-100 is a high energy, high
resolving power energy analyzer with imaging capability (ref. 1/2). It
offers modes of operation: In the first mode, complete RHEED diagrams are
energy filtered and can be viewed on a fluorescent screen. In the second
mode, in-situ energy loss distributions (EELS) for selected angular ranges
can measured. The analyzer offers the removal of the inelastically
scattered electrons (as it is the case in LEED optics) and the fast,
in-situ determination of the chemical state of the surface by EELS.
Further, RHEA-100 maintains all specific advantages of the RHEED
technique, such as in-situ imaging during growth, long working distances,
image acquisition with video-speed, and measurement of intensity
oscillations.
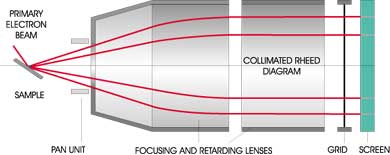
The analyzer is depicted in Figure 1. A lens system is used to retard and
collimate the diffracted electrons into a parallel beam. The collimated
beam is accurately energy filtered over a wide angular range. The filtered
electrons are accelerated to the screen to form a visible image. Complete
energy filtered RHEED diagrams are viewed on a large fluorescent screen
with an active surface of 130 mm in diameter. The diffuse background and
the Kikuchi-lines can be almost completely filtered out by adjusting the
filter voltage to a few eV below the primary beam energy. In addition,
electrons diffracted under the same angle are focused onto the screen,
thus increasing the coherence length of the system.
|
|
|
|
|
|
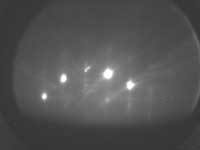
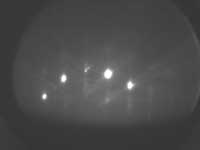
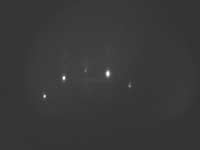
Figure (2) shows the RHEED patterns
measured on Si (111) at various filter voltages.
Figure (2a) is taken at 50 eV below the primary beam energy, Figure (2b)
at 22 eV, just on the top of the volume plasmon, Figure (2c) at the
elastic peak, and Figure (2d) just above the sharp cut-off voltage.
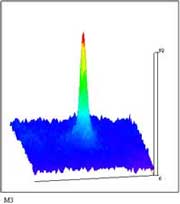 Figure 3a |
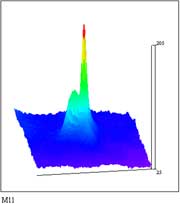 Figure 3b |
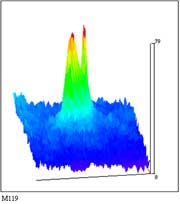 Figure 3c |
Figure (3) shows details of the variation of the angular distribution for various filter energies for the sharp diffraction spot located near the center. Distribution (Figure 3a) is obtained at the maximum of the elastic peak and distribution (Figure 3b) at the volume plasmon. The angular contribution of a specific energy loss is obtained subtracting the two distributions. This contribution is shown in Figure (3c). The geometry of the CCD camera is such that one pixel corresponds to an angle of 0.3 mrad.
|
Figure 4 |
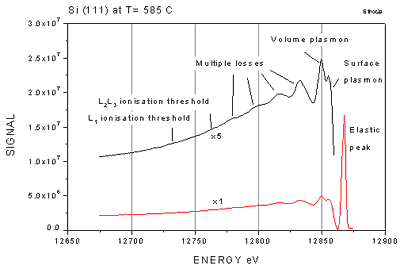
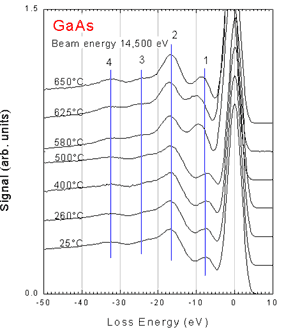
| The RHEA-100 RHEED Energy Analyzer allows in-situ measurements of Electron Energy Loss Spectra (EELS). The energy distribution electrons at different diffracted angles are measured using a highly sensitive photomultiplier and Lock-In technique. Since the energy losses are characteristic of the elemental composition and chemical environment of the surface, fast and sensitive characterizations are now possible during growth. Figure (4) shows an example of the EELS spectra taken from Si (111) and measured at a scan speed of 10 V/s. Surface plasmon, volume plasmon, and multiple energy losses are clearly detected. Scan speeds of up to 50 V/s can be used to detect the major losses. In-situ EELS data on GaAs and InP are reported in more details in references (1), see Figure 5. |
|
Highlights of the RHEA100 Energy Analyzer
| Energy resolution | better than 0.02% of primary energy |
| Energy range | 15,000 eV 20,000 eV or 30,000 eV |
| Electron detection | large diameter fluorescent screen |
| Filtered angle | 20 degrees |
| Data acquisition |
* Photomultiplier combined with Lock-In amplifier for EELS measurements |
| * CCD-Camera for observation of filtered diffraction patterns | |
| Mounting flange | CF 100 standard |
| Working distance | 50mm to 250mm |
| Working pressure | up to a few 10-5 torr |
References
| 1 | Proc. of the X International MBE conference, 1998, Cannes and Journal of Crystal Growth, to be published 1999 |
| 2 | Patent pending |
![]()
![]()
![]()
![]()