
| Electron guns offer a simple and efficient way to examine the sample structure and morphology more closely: the beam is scanned by means of deflection plates or magnetic coils and is focused to a small spot on the sample. Secondary electron emission occurs at the sample surface and this signal is used for imaging. As the primary electron beam is moving, area and structures with different secondary electron (SE) emission strengths (coefficient) are scanned. Variations of the SE are electronically processed and used to form the image. The simplest technique consists of measuring the variations of the sample current which yields low spatial resolution sample imaging, Scanning Electron Microscopy (SEM). Higher spatial resolution requires a secondary electron detector for more sensitivity and better control of the contrast. Another important application of the scanning technique is the measurement of Auger signals using an energy analyzer, which allows a direct mapping of chemical elements present on the surface, Scanning Auger Microscopy (SAM). | 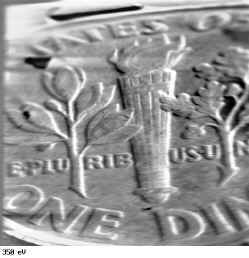 |
| Sample Positioning Low resolution SE imaging is particularly useful for positioning a sample at the focus of an energy analyzer. The integral electron gun is built inside the SUPERCMA energy analyzer for imaging the sample position and structures, providing spatial resolution capabilities down to 30 microns. Video scanning speed is preferred for fast imaging.
Scanning Electron Microscopy (SEM) For beam diameters below ca.10 microns, bright and detailed images of the sample are obtained in the SEM mode. A number of specific electron guns covering a wide range of beam diameters and energies are available. |
|
| Product model | Minimum beam diameter | Maximum energy | Optical design | |
| Fine focus EK-5-M | EK-5-M | 5 micron | 5,000 V | condensor, objective |
| EK-5-M2 | 3 micron | 5,000 V | ||
| Microfocus | EK-10-M | 500 nm | 10,000 V | condensor, objective, stigmator |
| EK-12-M | 200 nm | 12,000 V | 2 condensors, objective, stigmator | |
| Nanofocus | EK-15-N | 60 nm | 15,000 V | condensor, objective, stigmator |
| Scanning AUGER Microscopy The Auger signal is measured using an energy analyzer adjusted for transmission at a specific Auger line and the background signal is subtracted. The WinSpectro data acquisition system is used to control the spectrometer and enegy distributions are stored and processed digitally. The SUPERCMA analyzer is best suited for SAM applications. First, the sensitivity is very large, owing to the large subtended solid angle. Second, the resolution is computer selectable and can be chosen to give highest sensitivity. Third, the working distance is very large and fourth, the detected sample area can be as large as 4 mm diameter, (avoids frequent sample re- positioning). |
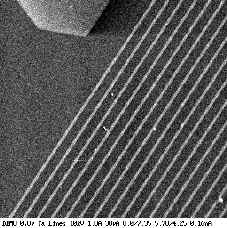 Test line measured with EK-12-M1 |
![]()
![]()
![]()